Phenoarch platform - Cleaning procedure - Curve level - gss package
I.Sanchez
septembre 04, 2020
gssAnalysisReport.RmdObjective of cleaning procedure using smoothing splines anova
Smoothing spline analysis of variance on each genotype-scenario of an experiment. Detection of outlier repetition if significant TT*Rep (thermal time by repetition) interaction using a Kullblack-Leibler projection (KL). I consider a genotype-scenario as outlier:
- biovolume: if KL > 0.05
- plantHeight: if KL > 0.05
- leafArea: if KL > 0.05
The input dataset must contain the following columns:
- experimentAlias
- genotypeAlias
- scenario
- repetition
- thermalTime (for thermal time)
- parameter of interest (biovolume, plantHeight etc…)
The five first column names are standard names extracted from the web service.
Import of data
  library(ggplot2)
  library(lubridate)
  library(tidyr)
  library(dplyr)
  library(gss)
  library(openSilexStatR)

  myreport<-substr(now(),1,10)
## -------------- plant3 dataset ---------------printExperiment(datain=plant3)
## Experiment: manip3
## Genotypes: 10
##  [1] "A3_H"     "A310_H"   "11430_H"  "A554_H"   "A374_H"   "A347_H"
##  [7] "B100_H"   "A375_H"   "AS5707_H" "A347"
## Scenario: 2
## [1] "WW" "WD"
## Repetition-scenario: 6
## [1] "1-WW" "2-WW" "3-WW" "1-WD" "2-WD" "3-WD"
## Pots (number of plants): 60
## Line: 25
## Position: 42
# Import data, here is a dataset in the phisStatR package, You have to import your own dataset # using a read.table() statement or a request to the web service # You can add some datamanagement statements... #------------------------------------------------------------------------ # Please, add the 'Ref' and 'Genosce' columns if don't exist. # 'Ref' is the concatenation of experimentAlias-Line-Position-scenario # 'Genosce' is the concatenation of experimentAlias-genotypeAlias-scenario #------------------------------------------------------------------------ mydata<-unite(plant3,Genosce,experimentAlias,genotypeAlias,scenario, sep="-",remove=FALSE) mydata<-arrange(mydata,Genosce)
  # For one parameter, for example biovolume
  resbio<-fitGSS(datain=mydata,trait="biovolume",loopId="Genosce")
Curves by genotype-scenario
Biovolume
  outlierbio<-printGSS(object=resbio,threshold = 0.05)
  klbio<-printGSS(object=resbio,threshold = NULL)

  cat("Detection of outlier curve with KL projection:\n")
## Detection of outlier curve with KL projection:print(outlierbio)
##              Genosce      ratio        kl     check
## 1  manip3-11430_H-WW 0.15015910 1175.7782 0.9999887
## 2 manip3-AS5707_H-WD 0.07205993  633.0729 0.9999874
#------------------------------------------------ # You can export these two datasets # suppress the comments #------------------------------------------------ #write.table(outlierbio,paste0(myreport,"outlier_gss_biovolume.csv"), # row.names = FALSE,sep="\t") #write.table(klbio,paste0(myreport,"KLprojection_gss_biovolume.csv"), # row.names = FALSE,sep="\t")
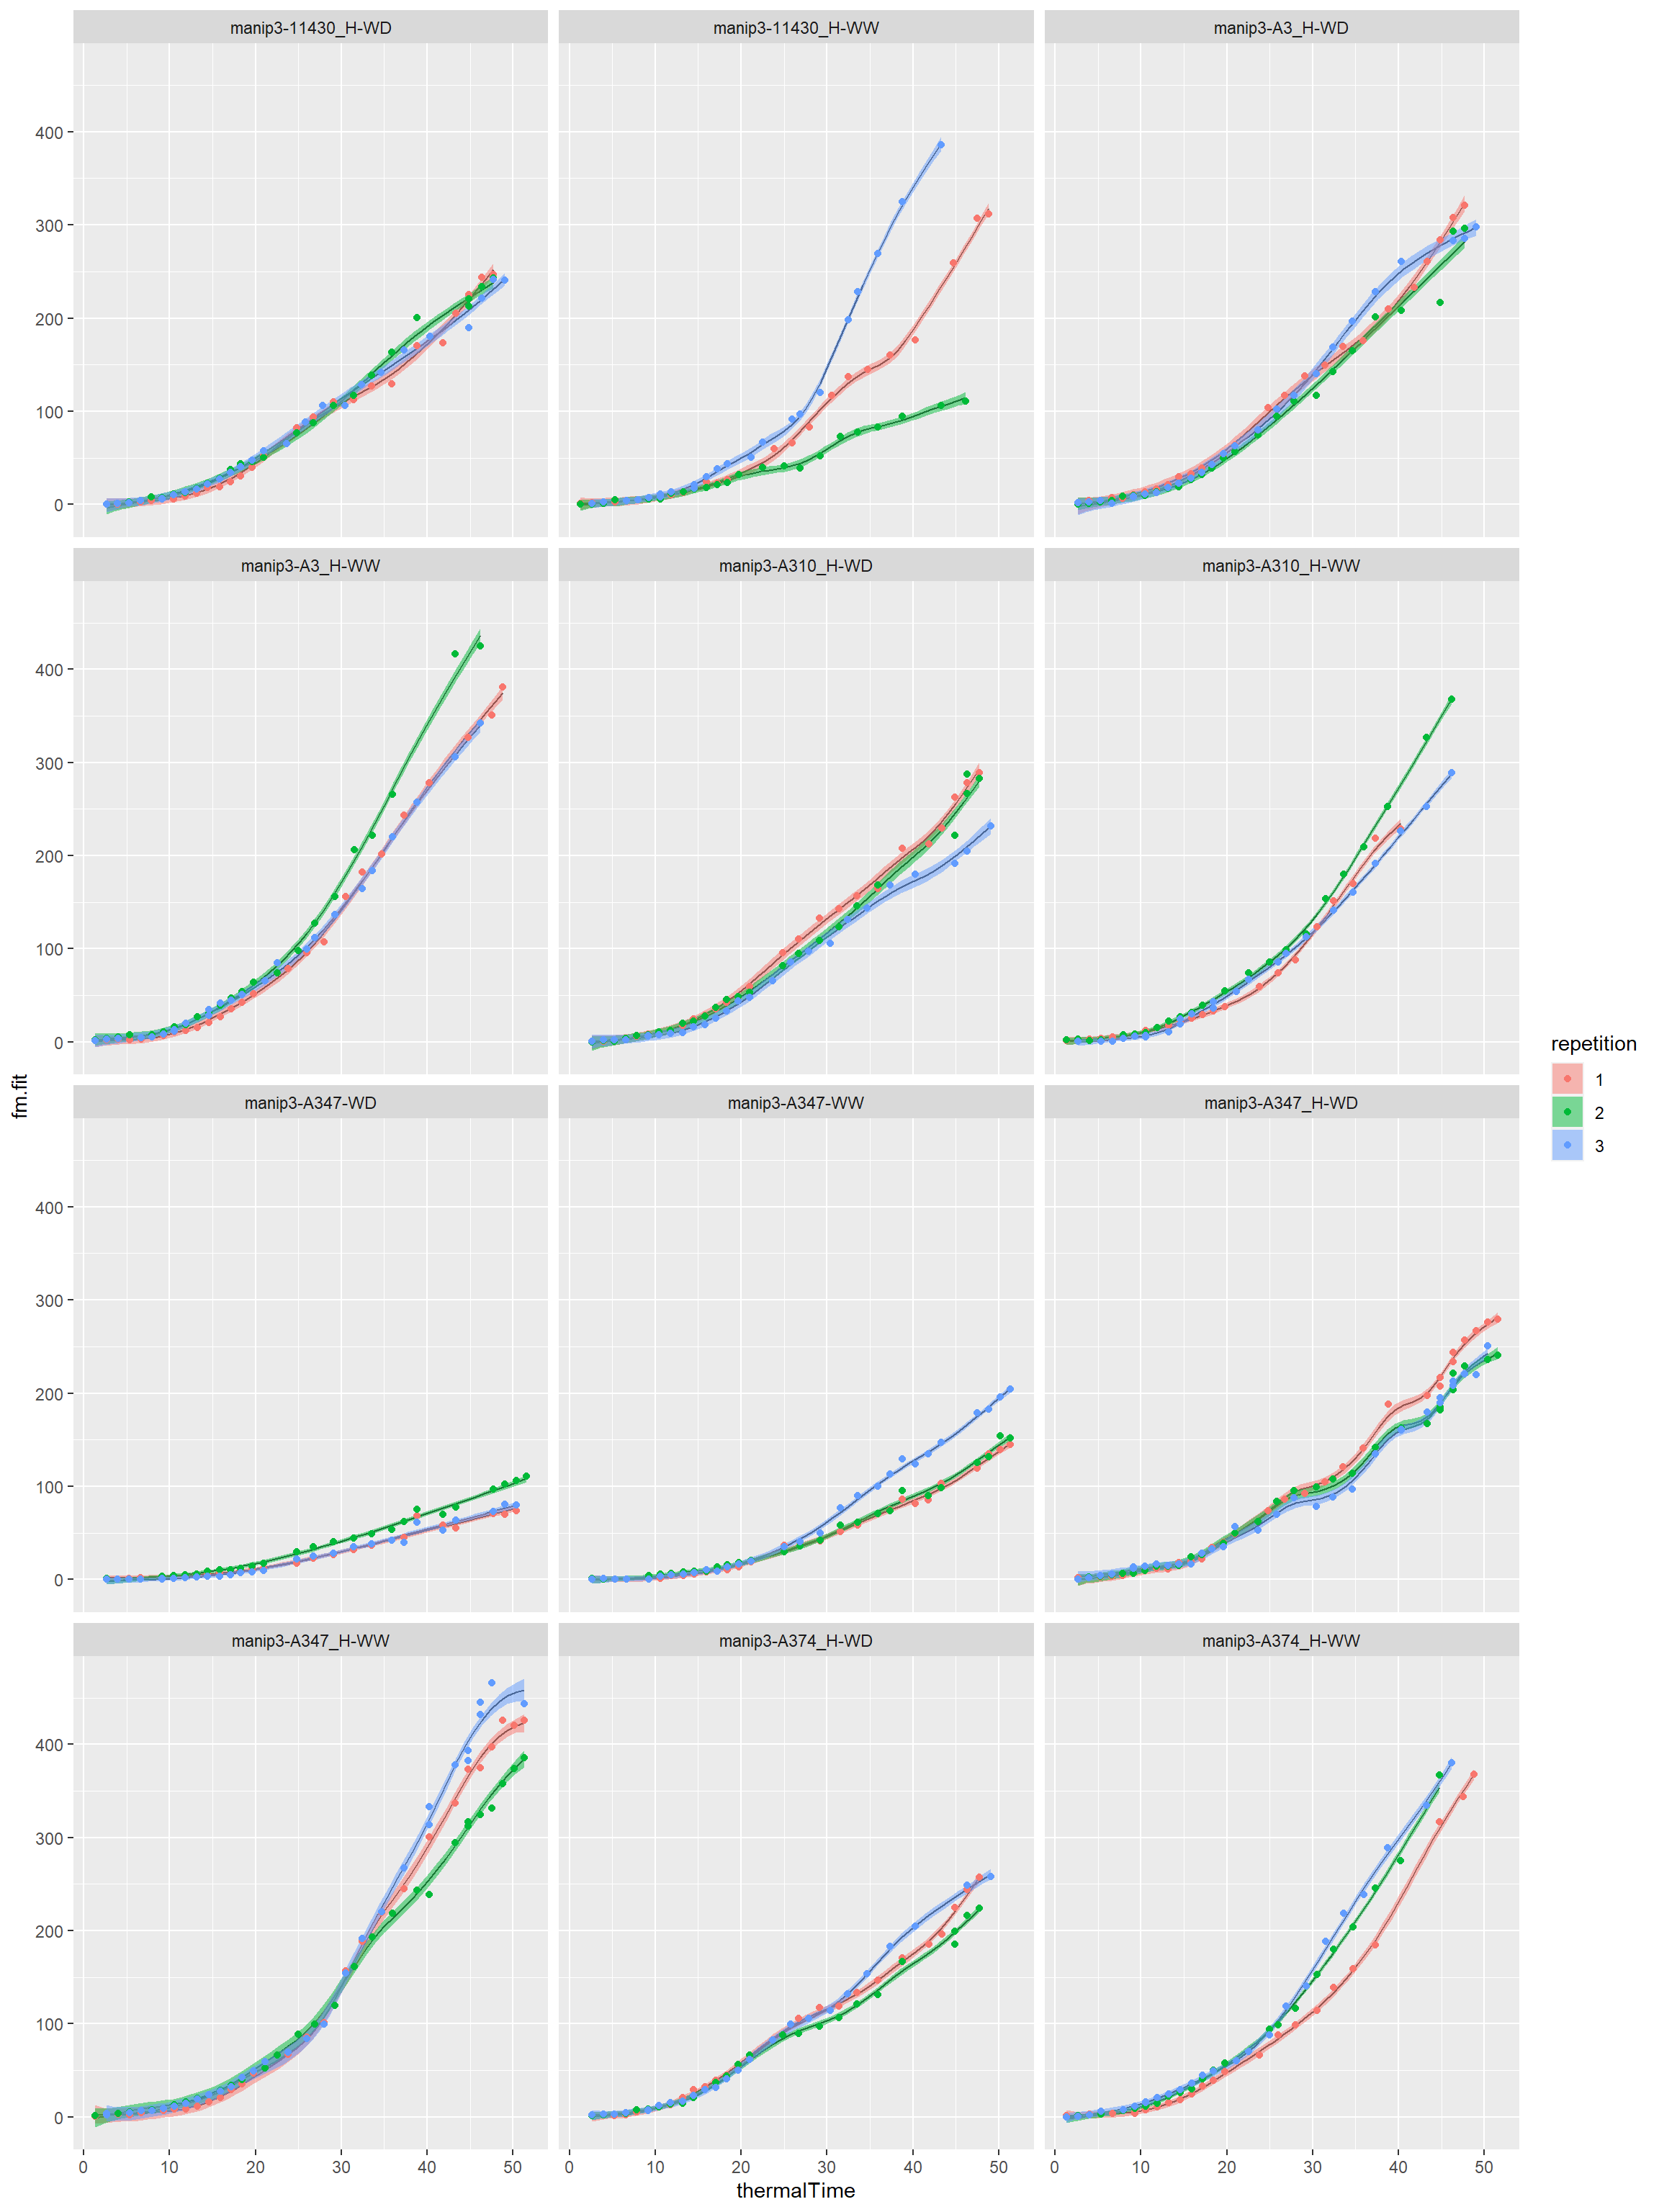
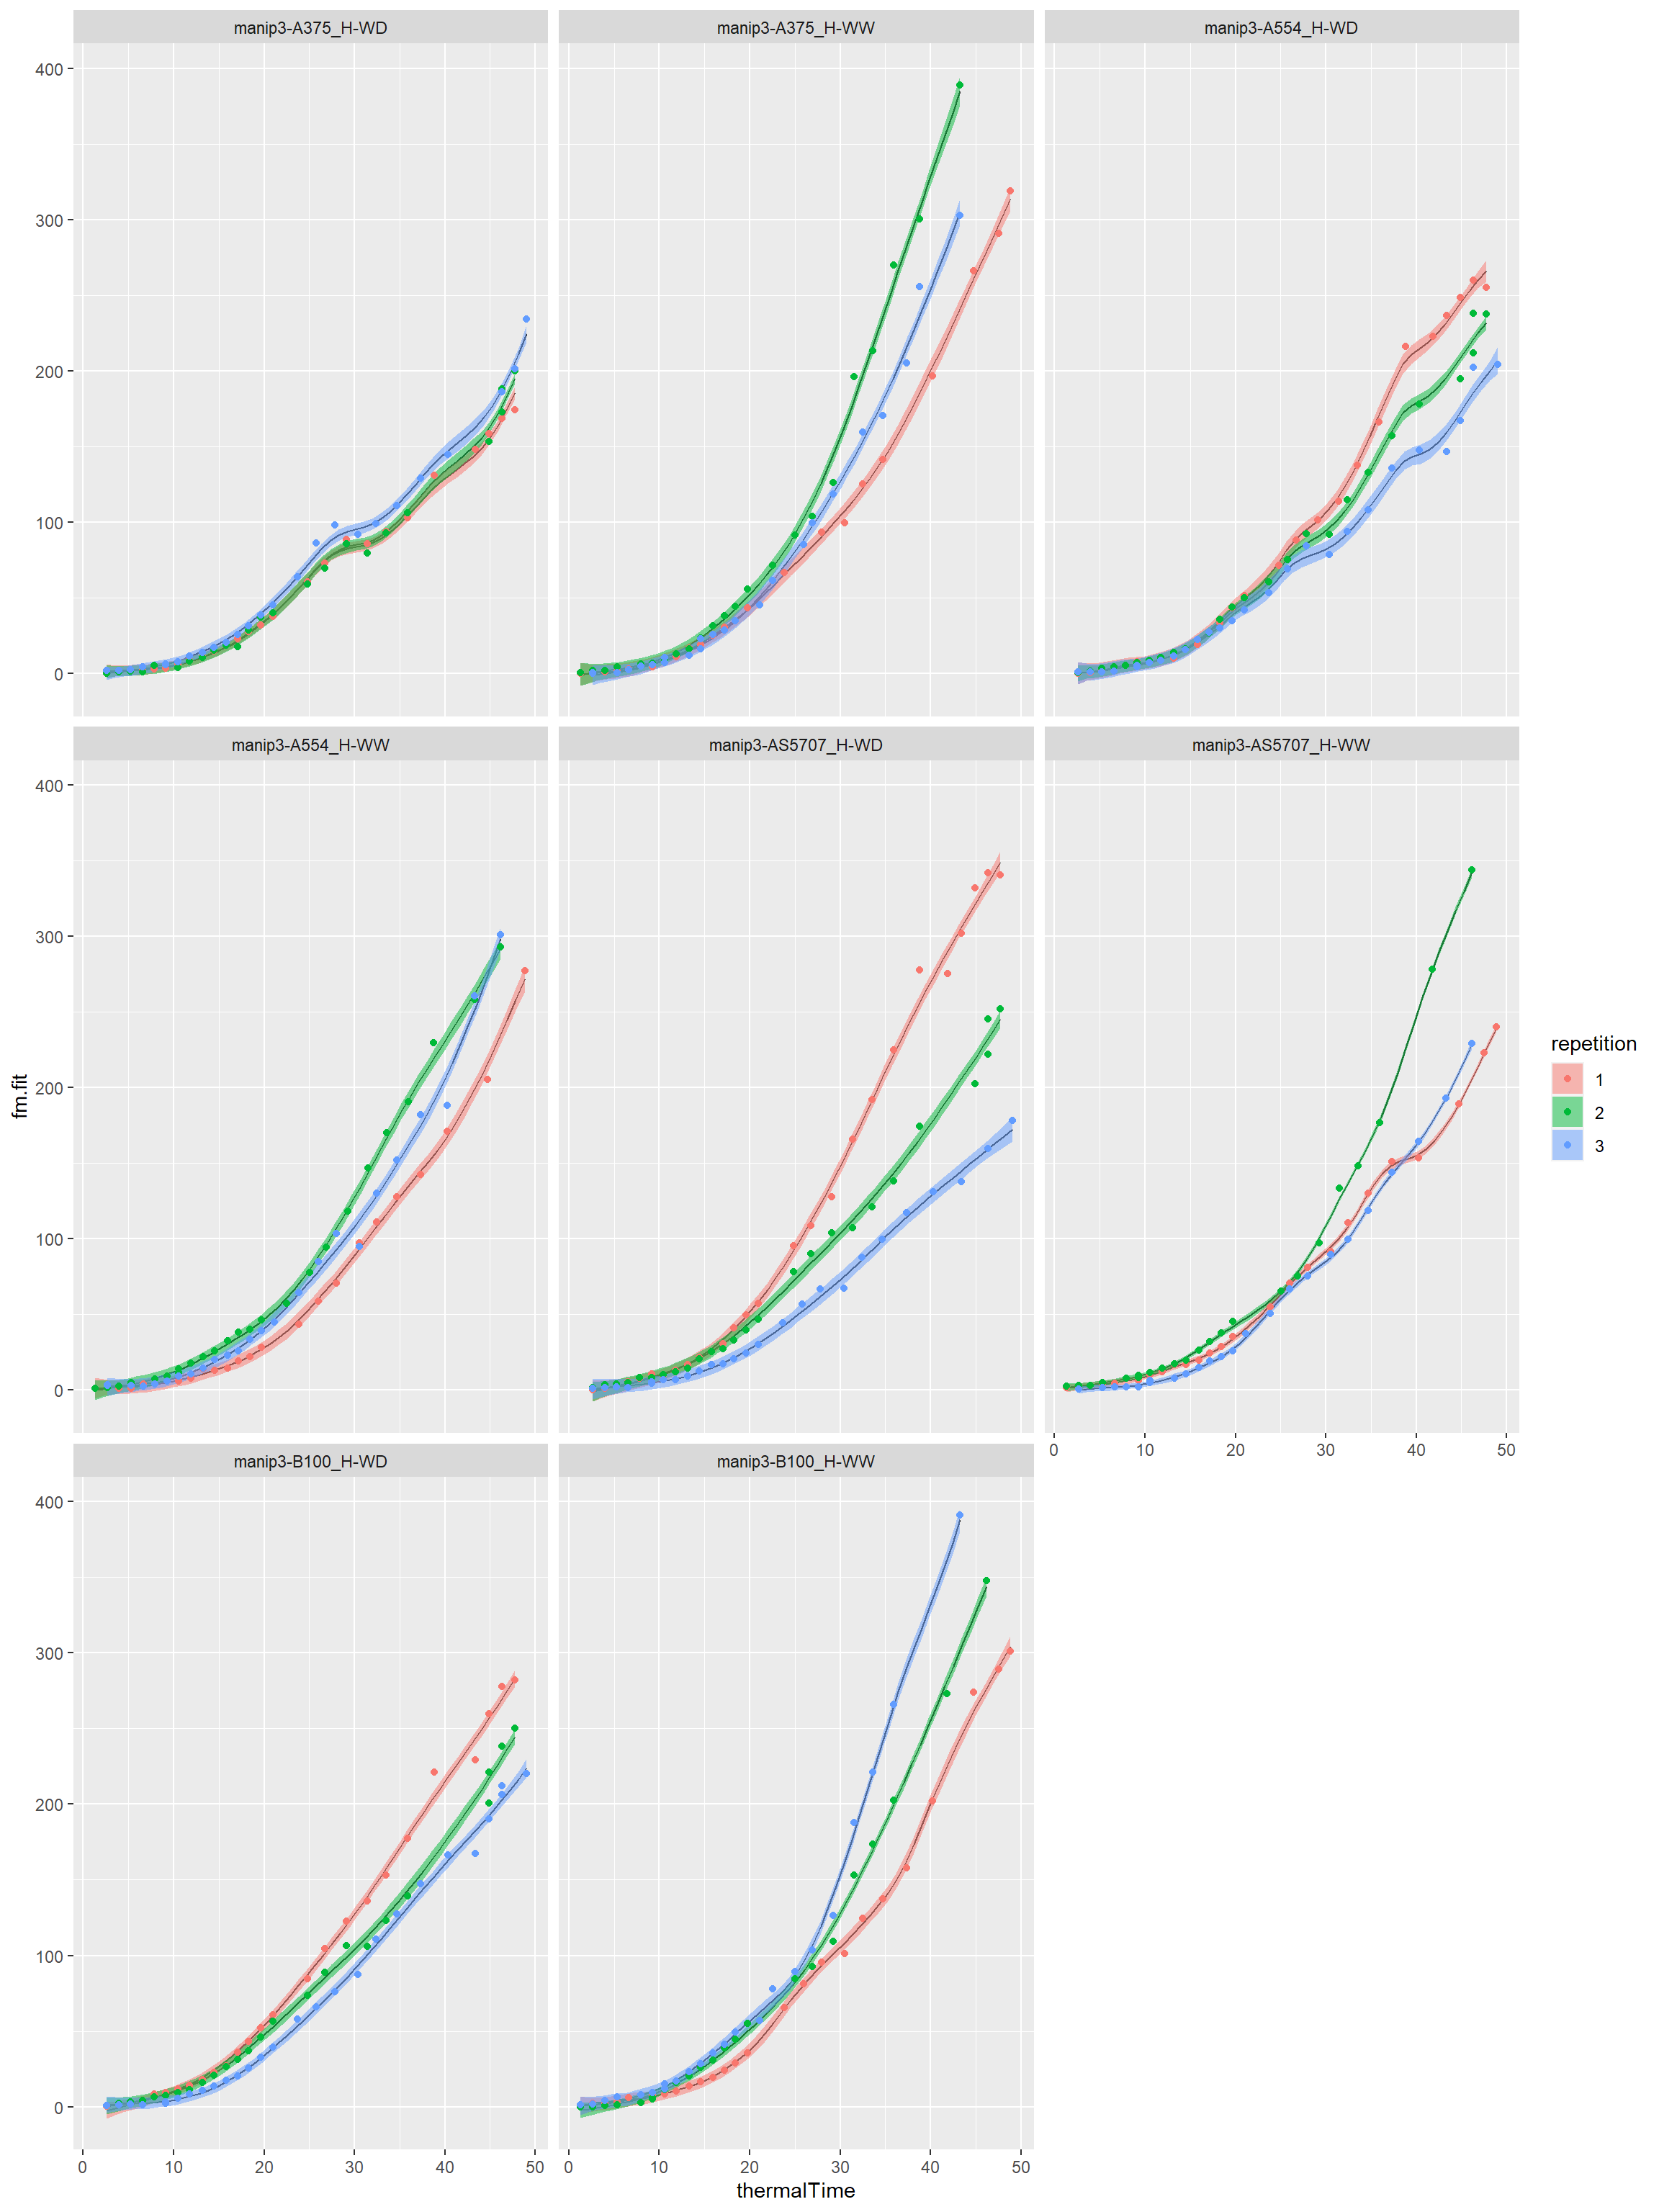
I take a threshold of 0.05 for this example. We can take a more conservative threshold like 0.01 or 0.02 to detect more outlier curves…
  # plot of the smoothing splines by genotype-scenario
  for(i in seq(1,length(unique(mydata[,"Genosce"])),by=12)){
    myvec<-seq(i,i+11,1)
    myvec<-myvec[myvec<=length(unique(mydata[,"Genosce"]))]
    print(plotGSS(datain=mydata,modelin=resbio[[1]],trait="biovolume",
                  myvec=myvec,lgrid=50))
    cat("\n\n")
  }
Session info
## R version 4.0.2 (2020-06-22)
## Platform: x86_64-w64-mingw32/x64 (64-bit)
## Running under: Windows 10 x64 (build 18363)
##
## Matrix products: default
##
## locale:
## [1] LC_COLLATE=French_France.1252  LC_CTYPE=French_France.1252
## [3] LC_MONETARY=French_France.1252 LC_NUMERIC=C
## [5] LC_TIME=French_France.1252
##
## attached base packages:
## [1] stats     graphics  grDevices utils     datasets  methods   base
##
## other attached packages:
## [1] openSilexStatR_1.1.0 gss_2.2-2            dplyr_1.0.2
## [4] tidyr_1.1.2          lubridate_1.7.9      ggplot2_3.3.2
##
## loaded via a namespace (and not attached):
##  [1] nlme_3.1-148       matrixStats_0.56.0 fs_1.4.2           sf_0.9-5
##  [5] gmodels_2.18.1     RColorBrewer_1.1-2 rprojroot_1.3-2    evd_2.3-3
##  [9] CARBayesdata_2.2   tools_4.0.2        backports_1.1.9    rgdal_1.5-16
## [13] R6_2.4.1           KernSmooth_2.23-17 spData_0.3.8       DBI_1.1.0
## [17] colorspace_1.4-1   raster_3.3-13      withr_2.2.0        CARBayesST_3.1
## [21] sp_1.4-2           tidyselect_1.1.0   gridExtra_2.3      GGally_2.0.0
## [25] leaflet_2.0.3      compiler_4.0.2     expm_0.999-5       desc_1.2.0
## [29] labeling_0.3       scales_1.1.1       classInt_0.4-3     pkgdown_1.5.1
## [33] stringr_1.4.0      digest_0.6.25      foreign_0.8-80     rmarkdown_2.3
## [37] pkgconfig_2.0.3    htmltools_0.5.0    htmlwidgets_1.5.1  rlang_0.4.7
## [41] rstudioapi_0.11    generics_0.0.2     farver_2.0.3       crosstalk_1.1.0.1
## [45] gtools_3.8.2       spdep_1.1-5        magrittr_1.5       shapefiles_0.7
## [49] dotCall64_1.0-0    Matrix_1.2-18      Rcpp_1.0.5         munsell_0.5.0
## [53] lifecycle_0.2.0    truncdist_1.0-2    stringi_1.4.6      yaml_2.2.1
## [57] MASS_7.3-51.6      plyr_1.8.6         matrixcalc_1.0-3   grid_4.0.2
## [61] gdata_2.18.0       crayon_1.3.4       deldir_0.1-28      lattice_0.20-41
## [65] splines_4.0.2      knitr_1.29         pillar_1.4.6       boot_1.3-25
## [69] codetools_0.2-16   stats4_4.0.2       LearnBayes_2.15.1  glue_1.4.2
## [73] evaluate_0.14      data.table_1.13.0  vctrs_0.3.4        spam_2.5-1
## [77] testthat_2.3.2     gtable_0.3.0       purrr_0.3.4        reshape_0.8.8
## [81] assertthat_0.2.1   xfun_0.16          SpATS_1.0-11       e1071_1.7-3
## [85] coda_0.19-3        class_7.3-17       truncnorm_1.0-8    tibble_3.0.3
## [89] memoise_1.1.0      units_0.6-7        ellipsis_0.3.1
References
- R Development Core Team (2015). R: A language and environment for statistical computing. R Foundation for Statistical Computing, Vienna, Austria. ISBN 3-900051-07-0, URL http://www.R-project.org.
- Chong Gu (2014). Smoothing Spline ANOVA Models: R Package gss. Journal of Statistical Software, 58(5), 1-25. URL http://www.jstatsoft.org/v58/i05/.