Phenoarch platform - Cleaning procedure - Point level using locfit
I.Sanchez
septembre 04, 2020
detectOutlierPoint.RmdObjective
Detection of outlier points in time courses of an experiment in PhenoArch greenhouse. This procedure can be used in any kind of time courses data sets. It uses a locfit smoothing function from the locfit library [2]. For each time course of a dataset, a locfit smoothing is applied, predictive confidence interval calculated (Y\(\_\)hat +/- threshold*Y\(\_\)hat\(\_\)se).
Points are declared outlier if outside this confidence interval. the user choose the threshold.
FuncDetectPointOutlierLocFit: detection of outlier points in time courses
- @param datain input dataframe. This dataframe contains a set of time courses
- @param myparam character, name of the variable to model in datain (for example, Biomass, PH or LA and so on)
- @param mytime character, name of the time variable in datain which must be numeric
- @param myid character, name of the id variable in datain
- @param mylevel numeric, factor to calculate the confidence interval. Increase mylevel to exclude less outliers
- @param mylocfit numeric, The constant component of the smoothing parameter. (see the locfit()) Increase mylocfit to have a very smooth curve
@return a data.frame:
Ref: the id variable mytime: name of the time variable in datain myparam: name of the modeled variable in datain ypred: the locfit prediction sd_ypred: standard deviation of the prediction lwr: lower bound of the confidence interval upr: upper bound of the confidence interval outlier: flag of detected outlier (0 is outlier, 1 is not)
If a time course has less than 6 points, no smoothing would be done and a warning appears.
Import of data
In this vignette, we use a toy data set of the openSilexStatR library (anonymized real data set).
  mydata<-plant1
  str(mydata)
## 'data.frame':    47022 obs. of  14 variables:
##  $ Ref            : Factor w/ 1680 levels "manip1_10_10_WW",..: 131 131 131 131 131 131 131 131 131 131 ...
##  $ experimentAlias: Factor w/ 1 level "manip1": 1 1 1 1 1 1 1 1 1 1 ...
##  $ Day            : Factor w/ 42 levels "2013-02-01","2013-02-02",..: 3 4 5 6 7 9 9 10 11 12 ...
##  $ potAlias       : int  1 1 1 1 1 1 1 1 1 1 ...
##  $ scenario       : Factor w/ 2 levels "WD","WW": 2 2 2 2 2 2 2 2 2 2 ...
##  $ genotypeAlias  : Factor w/ 274 levels "11430_H","A310_H",..: 165 165 165 165 165 165 165 165 165 165 ...
##  $ repetition     : int  1 1 1 1 1 1 1 1 1 1 ...
##  $ Line           : int  1 1 1 1 1 1 1 1 1 1 ...
##  $ Position       : int  1 1 1 1 1 1 1 1 1 1 ...
##  $ thermalTime    : num  1.29 2.65 3.98 5.32 6.66 ...
##  $ plantHeight    : num  140 151 213 239 271 ...
##  $ leafArea       : num  0.018 0.019 0.0208 0.0222 0.0235 ...
##  $ biovolume      : num  0.253 0.62 1.201 1.68 3.396 ...
## $ Repsce : Factor w/ 15 levels "1_WD","1_WW",..: 2 2 2 2 2 2 2 2 2 2 ...Outlier points detection
I have chosen a smoothing parameter of 30 and a threshold of 10 to detect the outlier points.
  # Selection of only 2 genotypes to speed up the process
  plantSel <- c("11430_H","A310_H")
  mydataSub <- filter(mydata,genotypeAlias %in% plantSel)

  resu1<-FuncDetectPointOutlierLocFit(datain=mydataSub,myparam="biovolume",
               mytime="thermalTime",myid="potAlias",
               mylevel=10,
               mylocfit=30)
Graphic
plotDetectPointOutlierLocFit(datain=mydataSub,resuin=resu1,
                              myparam="biovolume",
                              mytime="thermalTime",
                              myid="potAlias")
## Warning: Removed 15 rows containing missing values (geom_point).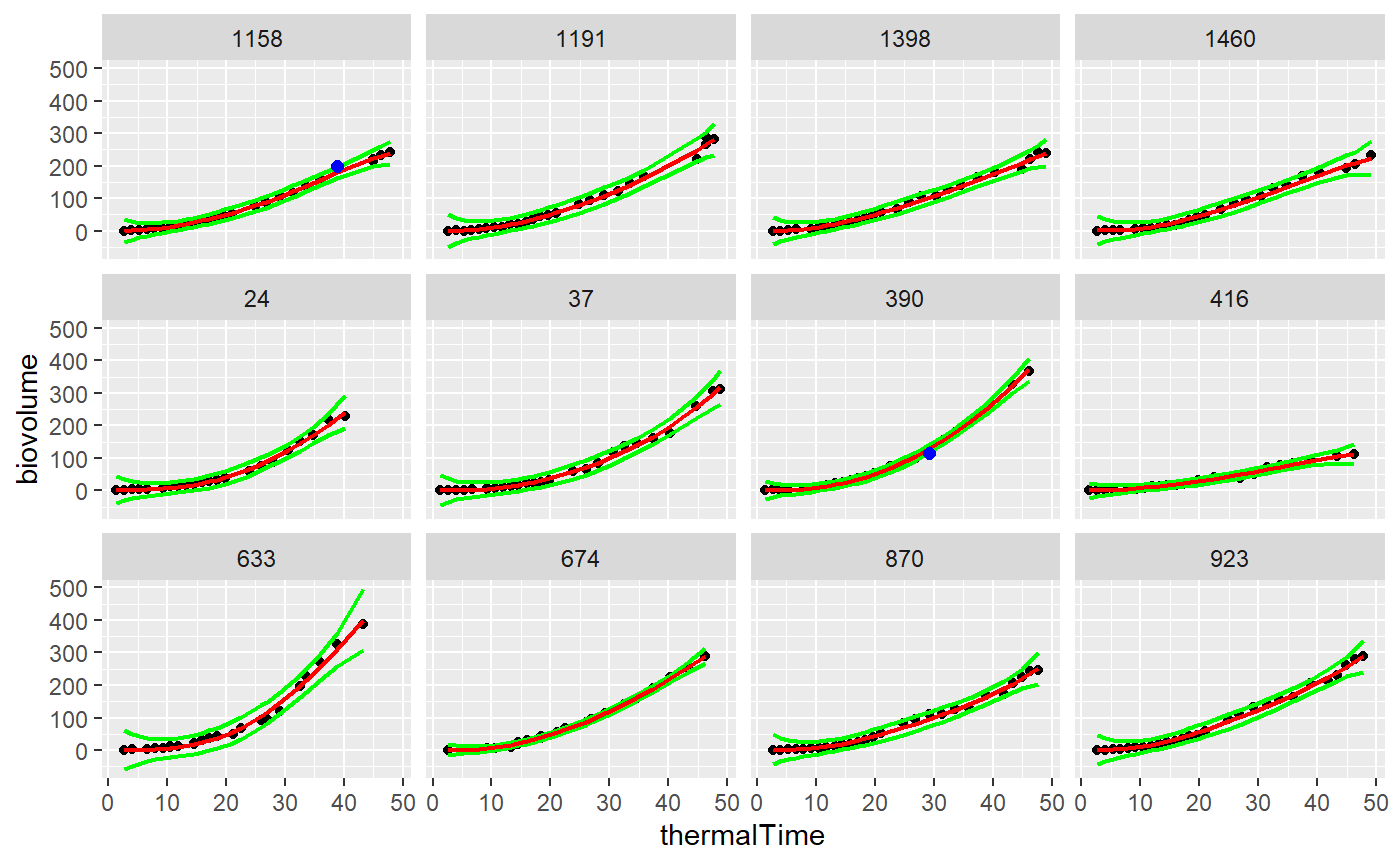
Session info
## R version 4.0.2 (2020-06-22)
## Platform: x86_64-w64-mingw32/x64 (64-bit)
## Running under: Windows 10 x64 (build 18363)
##
## Matrix products: default
##
## locale:
## [1] LC_COLLATE=French_France.1252  LC_CTYPE=French_France.1252
## [3] LC_MONETARY=French_France.1252 LC_NUMERIC=C
## [5] LC_TIME=French_France.1252
##
## attached base packages:
## [1] stats     graphics  grDevices utils     datasets  methods   base
##
## other attached packages:
## [1] openSilexStatR_1.1.0 locfit_1.5-9.4       dplyr_1.0.2
## [4] lubridate_1.7.9
##
## loaded via a namespace (and not attached):
##  [1] tidyr_1.1.2        splines_4.0.2      dotCall64_1.0-0    gtools_3.8.2
##  [5] assertthat_0.2.1   expm_0.999-5       CARBayesdata_2.2   sp_1.4-2
##  [9] stats4_4.0.2       yaml_2.2.1         LearnBayes_2.15.1  truncdist_1.0-2
## [13] pillar_1.4.6       backports_1.1.9    lattice_0.20-41    glue_1.4.2
## [17] digest_0.6.25      RColorBrewer_1.1-2 colorspace_1.4-1   plyr_1.8.6
## [21] htmltools_0.5.0    Matrix_1.2-18      pkgconfig_2.0.3    raster_3.3-13
## [25] CARBayesST_3.1     gmodels_2.18.1     purrr_0.3.4        scales_1.1.1
## [29] gdata_2.18.0       tibble_3.0.3       farver_2.0.3       generics_0.0.2
## [33] ggplot2_3.3.2      ellipsis_0.3.1     magrittr_1.5       crayon_1.3.4
## [37] deldir_0.1-28      memoise_1.1.0      evaluate_0.14      GGally_2.0.0
## [41] fs_1.4.2           nlme_3.1-148       MASS_7.3-51.6      foreign_0.8-80
## [45] truncnorm_1.0-8    class_7.3-17       data.table_1.13.0  tools_4.0.2
## [49] shapefiles_0.7     lifecycle_0.2.0    matrixStats_0.56.0 stringr_1.4.0
## [53] munsell_0.5.0      compiler_4.0.2     pkgdown_1.5.1      e1071_1.7-3
## [57] evd_2.3-3          rlang_0.4.7        classInt_0.4-3     units_0.6-7
## [61] grid_4.0.2         rstudioapi_0.11    htmlwidgets_1.5.1  spam_2.5-1
## [65] crosstalk_1.1.0.1  labeling_0.3       rmarkdown_2.3      SpATS_1.0-11
## [69] boot_1.3-25        testthat_2.3.2     gtable_0.3.0       codetools_0.2-16
## [73] reshape_0.8.8      DBI_1.1.0          R6_2.4.1           gridExtra_2.3
## [77] knitr_1.29         rgdal_1.5-16       rprojroot_1.3-2    spdep_1.1-5
## [81] KernSmooth_2.23-17 desc_1.2.0         matrixcalc_1.0-3   stringi_1.4.6
## [85] Rcpp_1.0.5         vctrs_0.3.4        sf_0.9-5           leaflet_2.0.3
## [89] spData_0.3.8       tidyselect_1.1.0   xfun_0.16          coda_0.19-3
References
- R Development Core Team (2015). R: A language and environment for statistical computing. R Foundation for Statistical Computing, Vienna, Austria. ISBN 3-900051-07-0, URL http://www.R-project.org.
- Catherine Loader (2013). locfit: Local Regression, Likelihood and Density Estimation.. R package version 1.5-9.1. https://CRAN.R-project.org/package=locfit